
 Trending Creators in 2025
$Intel(INTC.US)
〖Trivia〗Episode 2:
Inferring market expectations for earnings volatility based on at-the-money straddle options.
Taking INTC as an example: The prices of the nearest-term straddle options closest to the current stock price are 2.01 and 1.91 respectively, with the current price at 38.12. The calculation process is as follows:
1️⃣2.01+1.91=3.92
2️⃣3.92/38.12=0.1028331584
From this, it can be inferred that the stock price fluctuation range of INTC on the 23rd earnings day (with only 68% confidence): around ±10%
There is also another method based on implied volatility, but the formula is a bit complex and not very intuitive, so I won't share it.
$Unitedhealth(UNH.US)$Amazon(AMZN.US)

$Unitedhealth(UNH.US)$Alphabet - C(GOOG.US)$Amazon(AMZN.US)$JD.com(JD.US)
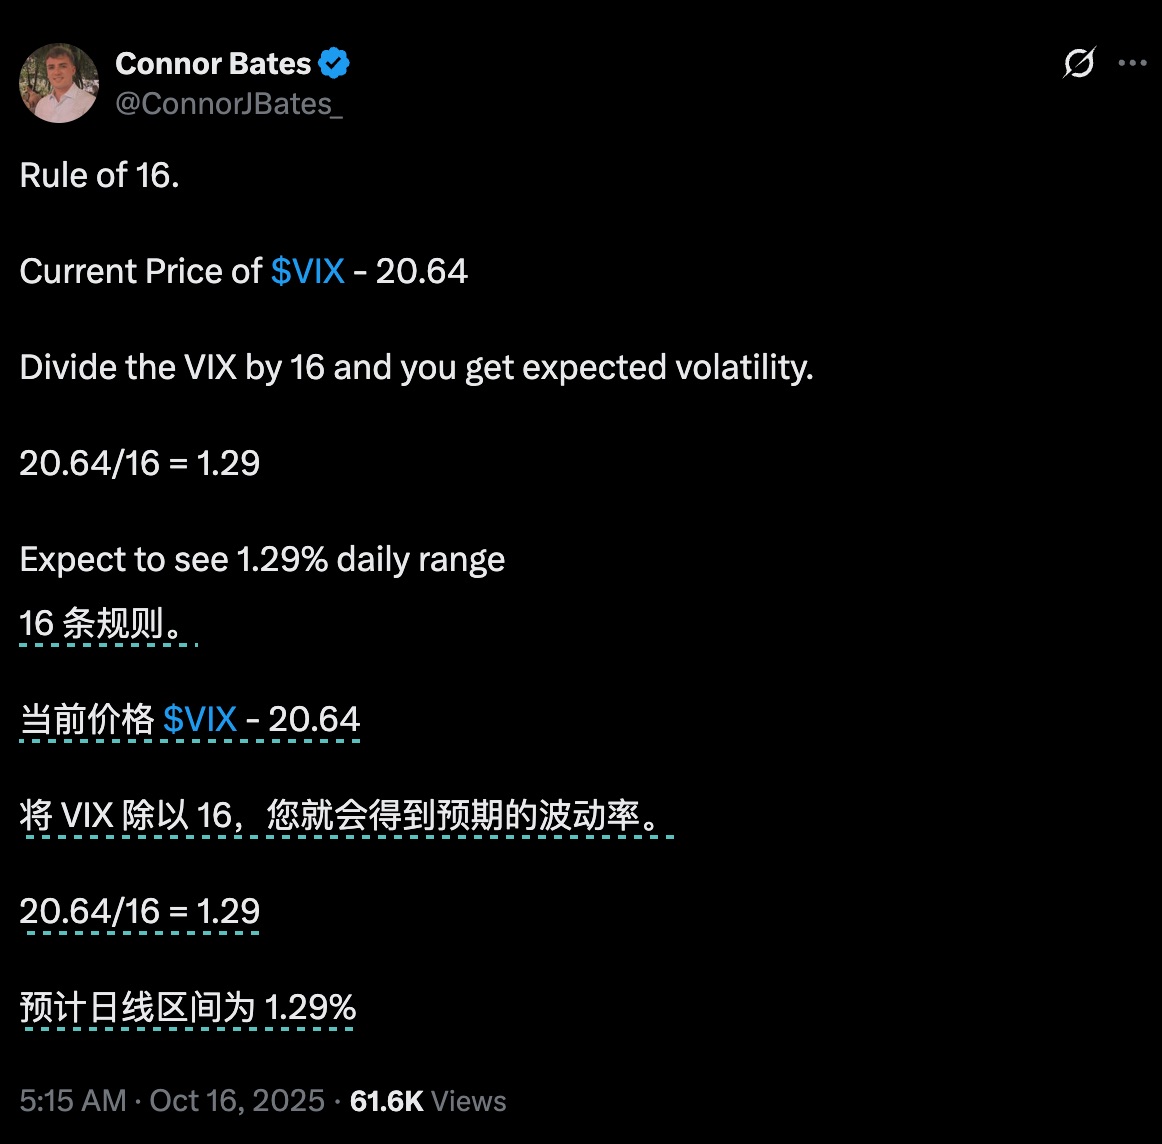
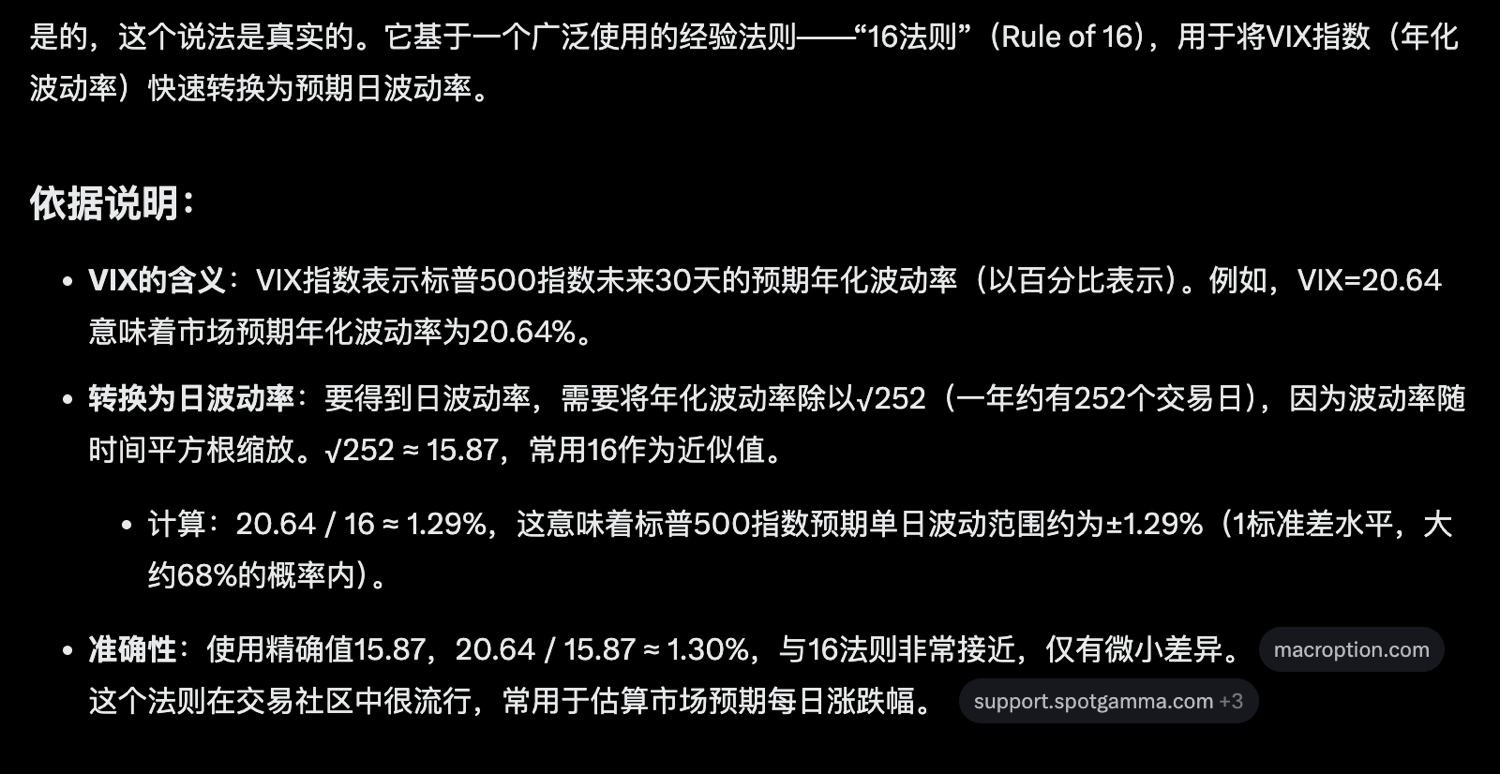
VIX Fear Index Trivia: The "16 Rule" roughly determines the day's market volatility.
For example: Today's $VIX price is 20.64
Divide VIX by 16, and you'll get the expected daily volatility.
20.64/16=1.29
The estimated daily market fluctuation range is 1.29%
The copyright of this article belongs to the original author/organization.
The views expressed herein are solely those of the author and do not reflect the stance of the platform. The content is intended for investment reference purposes only and shall not be considered as investment advice. Please contact us if you have any questions or suggestions regarding the content services provided by the platform.
